Initiating coverage | Cap. Goods
September 25, 2012
Disa India
BUY
CMP
`2,678
Delisting effort to revisit
Target Price
`3,353
Disa India (Disa), an 86.5% subsidiary of Disa Holding AG, is a market leader in
Investment Period
12 Months
manufacturing modern foundry equipment with a 70% market share in India. As
Stock Info
per the June 2010 amendment of Securities Contract (Regulations) Act, all listed
Sector
Capital Goods
companies should have a minimum of 25% public shareholding by June 2013.
Market Cap (Rs cr)
404
Since the promoters’ stake in Disa is at 86.5%, we believe that the company may
Net Debt
(17)
opt for delisting rather than diluting its stake considering the company has tried
Beta
0.4
delisting in the past. If the delisting doesn’t get through, still the stock is trading at
52 Week High / Low
3,944 / 1,401
Avg. Daily Volume
483
an attractive valuation of 12.8x its CY2013E EPS, owing to the company’s
Face Value (Rs)
10
collaboration with Wheelabrator’s technologies, continuous expansion and
BSE Sensex
18,694
improving order book. We initiate coverage on the stock, with a Buy
Nifty
5,674
recommendation and a target price of `3,353.
Reuters Code
DISA.BO
Bloomberg Code
BMD IN
Potential delisting candidate: The amendment of Securities Contract Act in June
2010 mandates all listed companies to have a minimum
25% public
Shareholding Pattern (%)
shareholding by June 2013. We believe, Disa being a multinational company
Promoters
86.5
(MNC)’s subsidiary, with the global company holding an 86.5% stake, may opt
MF / Banks / Indian Fls
0.0
for delisting since it has a history of delisting effort in CY2007.
FII / NRIs / OCBs
1.1
Business scenario upbeat: Disa’s continuous capacity expansion complementing its
Indian Public / Others
12.4
improving order book would be a major growth driver. Moreover, the company’s
collaboration with Wheelabrator’s technologies would not only provide access to new
Abs. (%)
3m 1yr 3yr
target markets, but also improve profitability by reducing cost per part.
Sensex
10.7
16.5
12.0
Strong balance sheet: We expect Disa to post a modest 14.8% and 15.6% CAGR in its
Disa
4.2
80.8
62.3
revenue and profit, respectively, over CY2011-13E. Disa’s debt free position and cash
reserves indicate its strength in situation of worsening economic environment. At the
current market price of `2,678, the stock is trading at a PE of 12.8x for CY2013E
earnings, which we believe is attractive for an MNC. We initiate coverage on the stock
with a target price of `3,353 based on a target PE of 16.0x for CY2013E.
Key Financials
Y/E December (` cr)
CY2010
CY2011 CY2012E
CY2013E
Net Sales
108
154
176
203
% chg
51.0
43.1
14.6
15.0
Net Profit
15
23
28
32
% chg
14.0
14.7
15.6
15.6
EBITDA (%)
19.6
20.7
22.7
22.6
EPS (`)
100.1
150.1
182.4
209.6
P/E (x)
26.8
17.8
14.7
12.8
P/BV (x)
7.3
9.4
7.6
6.0
RoE (%)
27.1
52.5
51.8
47.0
RoCE (%)
39.8
59.8
75.6
69.5
Shareen Batatawala
EV/Sales (x)
3.3
2.2
2.0
1.7
+91-22-3935 7800 Ext: 6849
EV/EBITDA (x)
17.0
10.8
9.0
7.5
Source: Company, Angel Research
Please refer to important disclosures at the end of this report
1
Initiating coverage | Disa India
Investment Rationale
Potential delisting candidate
In June 2010, the government amended the Securities Contract (Regulations) Act
Historical delisting effort to revisit
rules, according to which all listed companies should have a minimum of 25%
public shareholding by June 2013.
The promoters (Disa Holding A/S) had made a delisting offer in April 2007 to
acquire up to 3,88,554 shares representing 25.73% stake in the company. The
delisting offer was rejected by the management due to high discovered price of
`2,960 per share.
In December 2008, Hamlet Holding II ApS along with Disa Holding II A/S, Disa
Holding A/S and DISA Holding AG, announced an open offer for acquisition of
upto 3,02,041 shares representing 20% of the paid-up equity share capital of Disa
India at a price of `1,657 per share. 1,84,485 shares were acquired in the offer
representing 12.22% of the total share capital amounting to `30.6cr. These shares
were held in the escrow account since the Securities and Exchange Board of India
(SEBI) contested the open offer price calculation. SEBI lost the case in Securities
Appellate Tribunal (SAT) and appealed to the Supreme Court. The Supreme Court
gave Disa’s promoters permission to transfer the shares even though the case is
still going on, since the company gave an undertaking to abide by the Supreme
Court’s decision, whatever it might be. The promoters now officially hold 86.5%.
Hence, in order to comply with the amended Securities Contract (Regulations) Act
the company may opt for delisting rather than diluting its stake.
Business scenario upbeat
Continuous expansion, improving order
Disa has been continuously expanding its manufacturing facilities at Tumkur and
inflow and Wheelabrator collaboration-
Hosakote plants. The company is now planning its third unit near Bangalore. We
indicators of improving business
expect these expansion plans to facilitate revenue growth going forward.
scenario
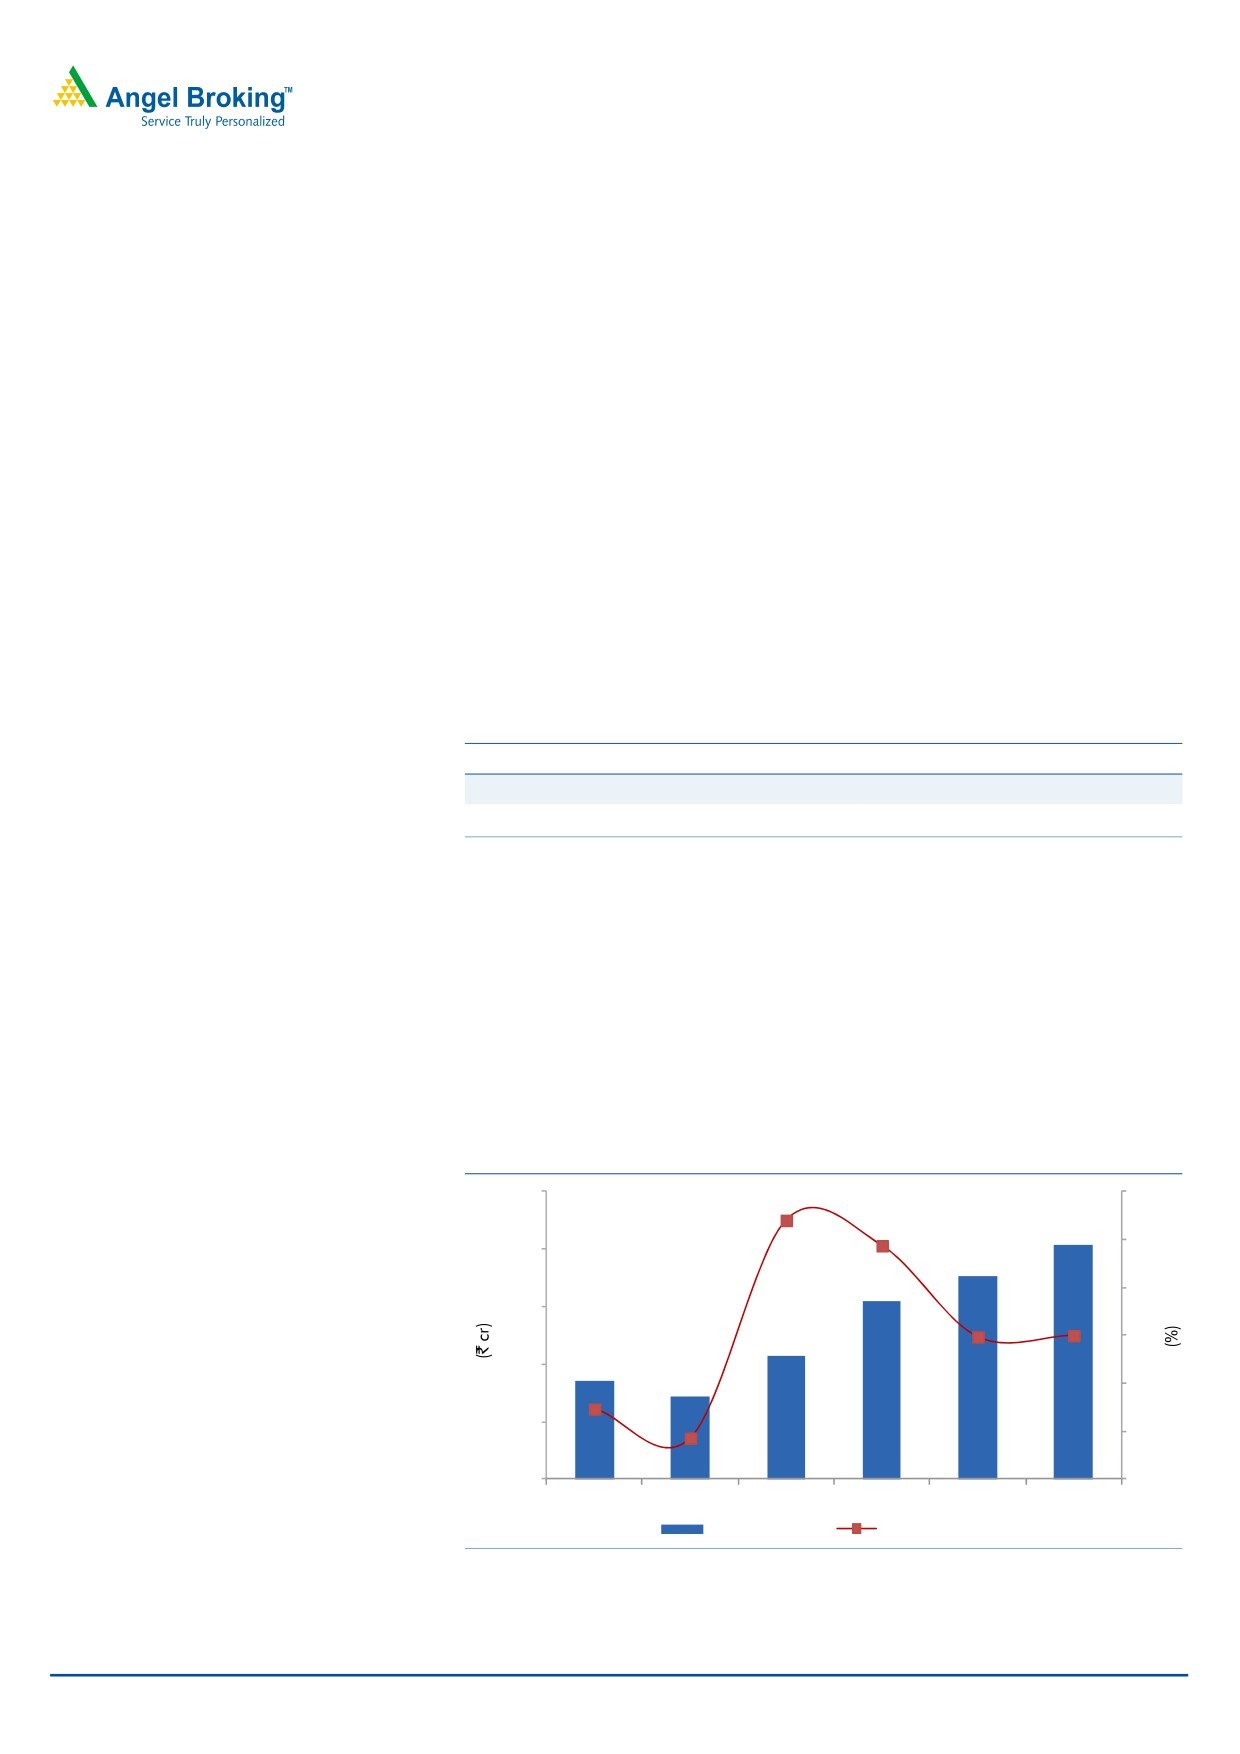
Moreover, improving order intake which has more than doubled over CY2008-11
from `70cr in CY2008 to `150 in CY2011, would monetize in future.
Exhibit 1: Order intake
250
80
67.1
60
200
40
150
23.0
14.5
20
14.8
100
4.3
0
50
(20)
70
(32.7)
73
122
150
172
197
0
(40)
CY2008
CY2009
CY2010
CY2011
CY2012E CY2013E
Order intake (LHS)
yoy growth (RHS)
Source: Company, Angel Research
September 25, 2012
2
Initiating coverage | Disa India
With the global merger of Wheelabrator group with Disa group in CY2009, Disa
would now get access to Wheelabrator’s surface preparation technology leading to
focus on new target markets, ie automotive and steel processing industries. The
automotive industry accounts for ~30% of the Indian foundry industry, thus
facilitating the company’s revenue growth. Moreover, a blend of the two
technologies would result in lower cost per part for the company, thus resulting in
better profitability.
Strong balance sheet will aid long term sustainability
Debt free position to shield against
Disa is a debt free company with cash reserves of `60cr for CY2011 and ROCE
economic instability
and ROE of 59.8% and 52.5% respectively. Thus, the interest rate volatility would
not have any direct impact on the company. In view of the recent economic
instability, the company’s strategy of being cash rich could serve as a savior if the
economy weakens further.
Financials
Exhibit 2: Key Assumptions
(%)
CY2012E
CY2013E
Growth in Foundry business
14.5
14.8
Growth in Air business
15.0
16.0
Source: Angel Research
Capacity expansion & better order intake to support revenue
growth
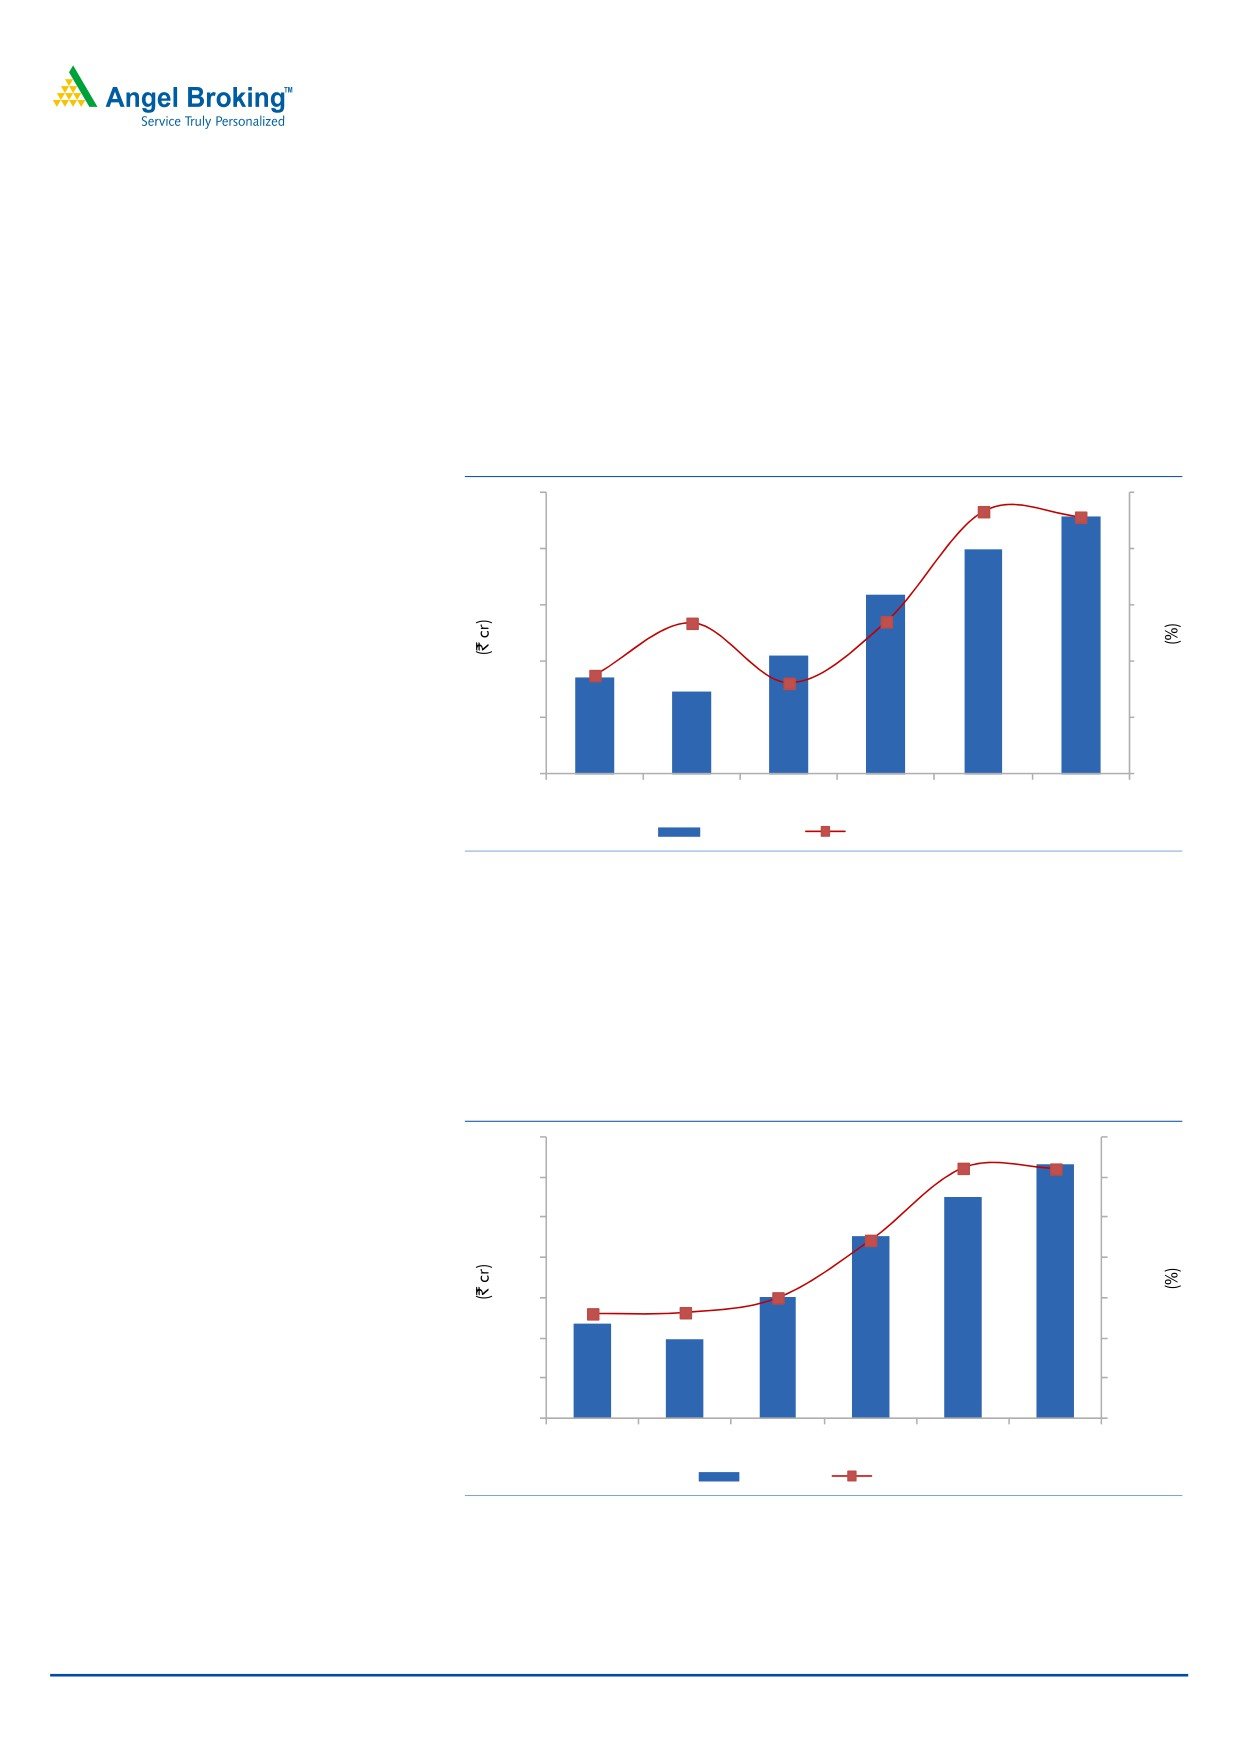
We expect the company to post a CAGR of 14.8% over CY2011-13E in its revenue
inspite of a decline in investment cycle. This growth would primarily be led by
improving order intake which witnessed a 28.9% CAGR over CY2008-11 and is
expected to grow at 14.6% over CY2011-13E. Moreover, continuous expansion
projects undertaken by the company would support growth.
Exhibit 3: Revenue to witness a stable growth
250
60
51.0
45
200
43.1
30
150
14.6
15
15.0
100
0
(8.0)
50
(15)
(17.0)
86
71
108
154
176
203
0
(30)
CY2008
CY2009
CY2010
CY2011
CY2012E CY2013E
Revenue (LHS)
Revenue growth (RHS)
Source: Company, Angel Research
September 25, 2012
3
Initiating coverage | Disa India
Technology collaboration benefits EBITDA margin
Disa reported relatively better EBITDA margin for 1HCY2012 as compared to
previous year on account of decline in net raw material cost as percentage of
sales. This was due to benefits arising from collaboration with Wheelabrator’s
surface preparation technology. We expect the trend to continue going forward;
we expect the EBITDA margin to expand by 187bp yoy to 22.7% in CY2012E. The
EBITDA margin is expected to stabilize at similar levels going forward.
Exhibit 4: EBITDA margin to stabilize at higher levels
50
22.7
23
22.6
40
22
20.7
20.7
30
21
19.7
19.6
20
20
10
19
17
15
21
32
40
46
0
18
CY2008
CY2009
CY2010
CY2011
CY2012E CY2013E
EBITDA (LHS)
EBITDA margin (RHS)
Source: Company, Angel Research
Net profit on an uptrend
Modest revenue growth and improving EBITDA margin is expected to lead to better
profit going forward. We expect the company to post an 18.2% CAGR in net profit
over CY2011-13E to `32cr in CY2013E.
Exhibit 5: PAT margin to inch higher
35
16.0
15.6
15.6
30
15.5
25
14.7
15.0
20
14.5
14.0
15
13.8
13.8
14.0
10
13.5
5
13.0
12
10
15
23
28
32
0
12.5
CY2008
CY2009
CY2010
CY2011
CY2012E CY2013E
PAT (LHS)
PAT margin (RHS)
Source: Company, Angel Research
September 25, 2012
4
Initiating coverage | Disa India
Outlook and Valuation
Disa has posted a stupendous performance on the top-line and bottom-line front
over CY2009-11 with a CAGR of 47.0% and 51.6% in revenue and profit,
respectively. We expect the growth to be modest at 14.8% CAGR over CY2011-
13E to `203cr due to a slowdown in the investment cycle. However, the EBITDA
margin is expected to expand by 186bp over CY2011-13E owing to benefits
arising from the collaboration with Wheelabrator’s technology. Thus, the net profit
is expected to grow at 18.2% CAGR over CY2011-13E to `32cr in CY2013E.
Moreover, higher promoter stake in the company at 86.5% makes it a potential
delisting candidate to ensure compliance with the amended Securities Contract
(Regulations) Act, which mandates a minimum of 25% public shareholding by June
2013. The stock is currently trading at a PE of 12.8x it CY2013E earnings and P/B
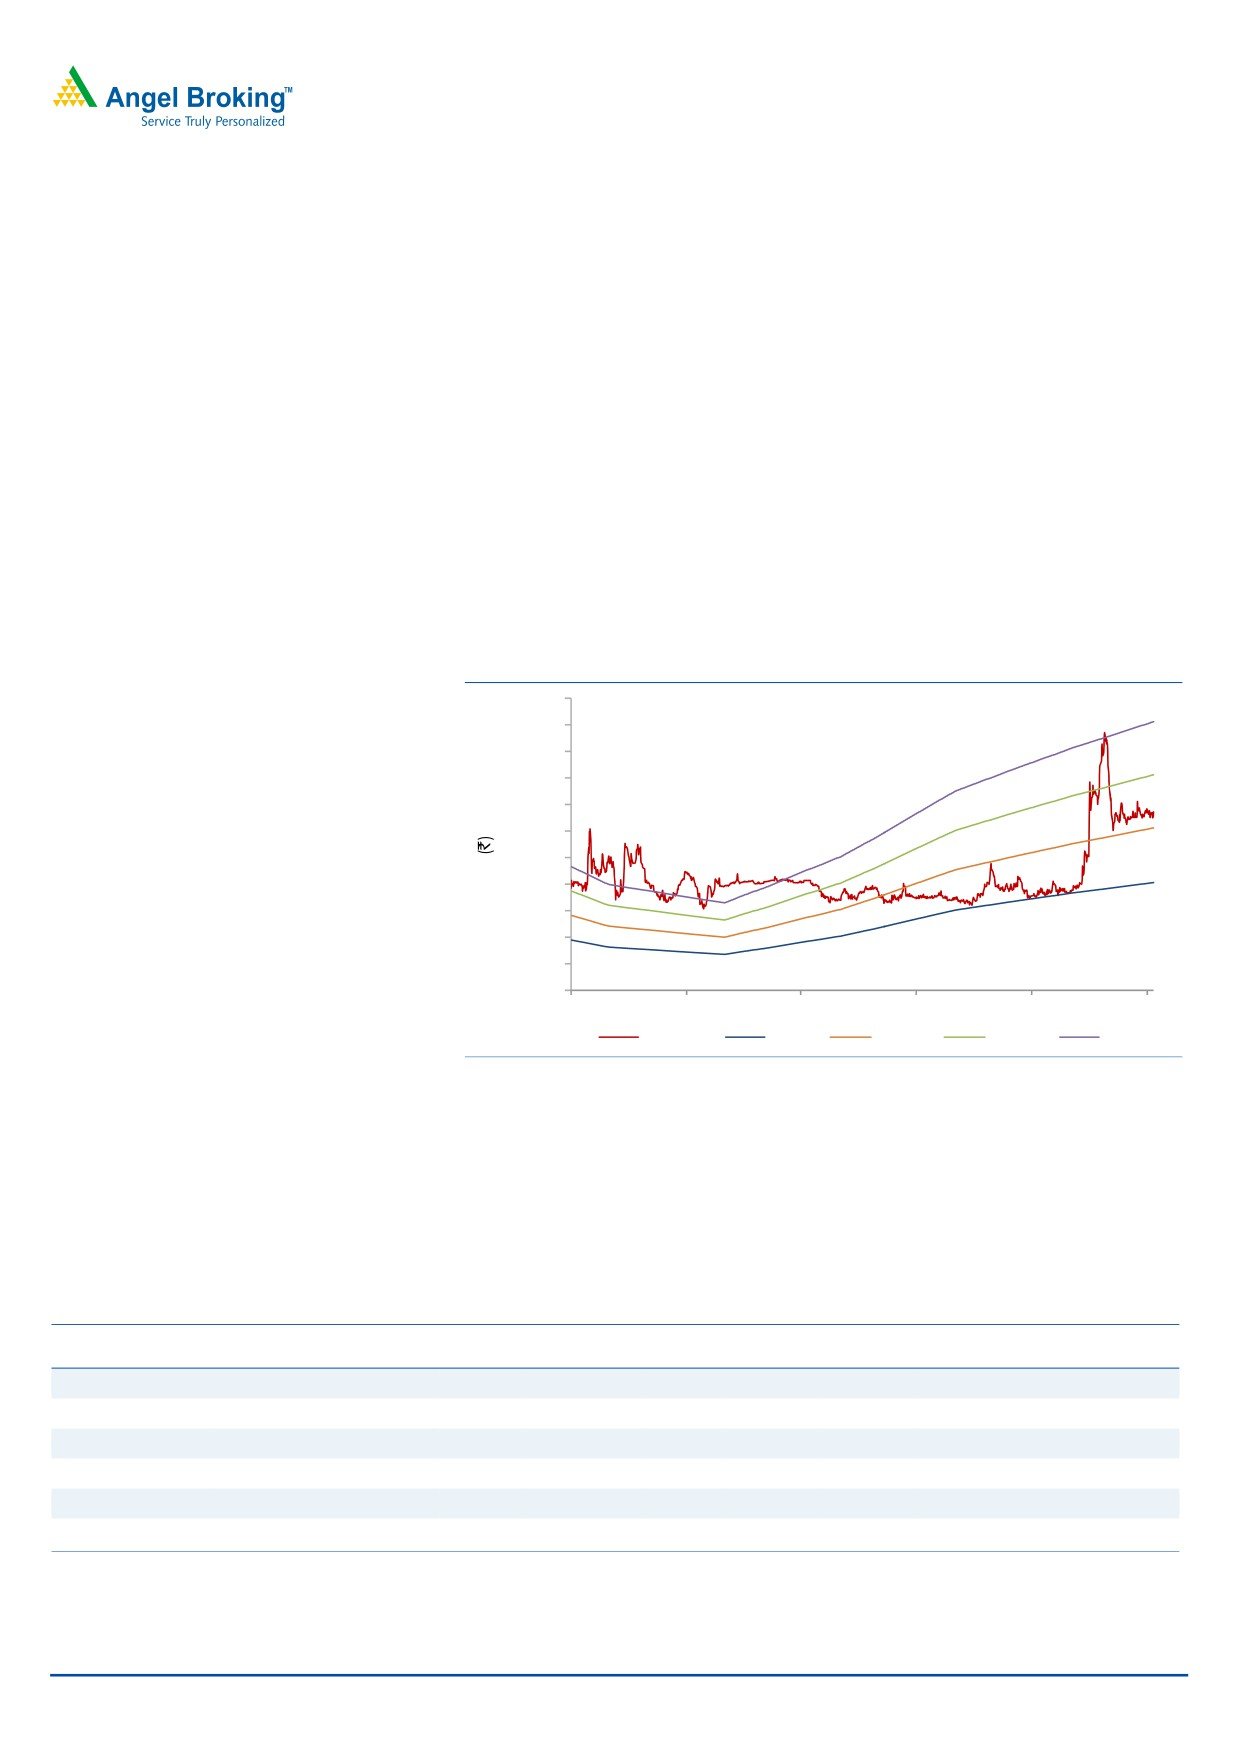
of 6.0x for CY2013E. We initiate coverage on Disa with a Buy rating and target
price of `3,353 based on a target PE of 16.0x for CY2013E.
Exhibit 6: One-year forward PE band
4,400
4,000
3,600
3,200
2,800
2,400
2,000
1,600
1,200
800
400
0
Sep-07
Sep-08
Sep-09
Sep-10
Sep-11
Sep-12
Price
8x
12x
16x
20x
Source: Company, Angel Research
Relative Valuation
Amongst MNC capital goods players, Disa has a better operating margin and ROE
profile than most other players. However, it is trading at an expensive valuation in
terms of EV/sales, due to delisting expectations.
Exhibit 7: Relative Valuation
Sales
OPM
PAT
EPS
ROE
P/E
P/BV
EV/EBITDA
EV/Sales
(` cr)
(%)
(` cr)
(`)
(%)
(x)
(x)
(x)
(x)
Disa
158
22.0
25
162.3
51.1
16.5
8.4
11.2
2.5
Vesuvius
565
16.3
52
25.6
16.1
13.0
2.1
7.1
1.2
Esab
534
12.1
38
24.5
100.0
18.3
18.3
9.8
1.2
Honda Siel
510
9.7
34
33.5
12.8
15.4
2.0
7.9
0.8
Igarashi
284
16.8
18
9.0
14.0
8.4
1.2
4.0
0.7
GMM
202
8.2
9
6.4
9.1
15.4
1.4
6.4
0.5
Source: Company, Angel Research (Note: Above numbers are for TTM ended June 2012)
September 25, 2012
5
Initiating coverage | Disa India
Key concerns
Unstable economic scenario to impact growth prospects
In view of the current economic condition where we are witnessing declining GDP,
increasing inflation, and policy paralysis and with a wavering political scenario
underway, India’s investment cycle is undergoing a slowdown. Since the foundry
industry is directly dependent on the country’s investment cycle, failure in revival of
the economy will impact the growth of the company.
Hurdles in delisting
Preferences given to public shareholders: The special resolution, which
requires public shareholders’ approval, mandates votes cast in favour of the
proposal to be at least two times the number of votes cast against it.
Minimum number of equity shares to be acquired: As per SEBI guidelines, an
offer would be successful if post offer, the shareholding of the promoter
reaches higher of a) 90% shares of the total issued shares; or b) the aggregate
percentage of pre-offer promoter shareholding plus 50% of the offer size.
Company Background
Disa India, an 86.5% subsidiary of Disa Holding AG, is a market leader in the
manufacturing of modern foundry equipment with a market share of 70% in India.
It supplies complete foundry systems by integrating the moulding machines and
sand mixers with proper combination of sand plant equipment, surface treatment
machines, environmental control systems and conveying systems. The company
has two manufacturing plants in Karnataka, one in Hosakote and other in Tumkur.
Collaboration of Disa’s moulding technology and Wheelabrator’s surface
preparation technology in CY2011 has led to lowering of lifecycle cost per part
along with access to new target markets.
September 25, 2012
6
Initiating coverage | Disa India
Industry
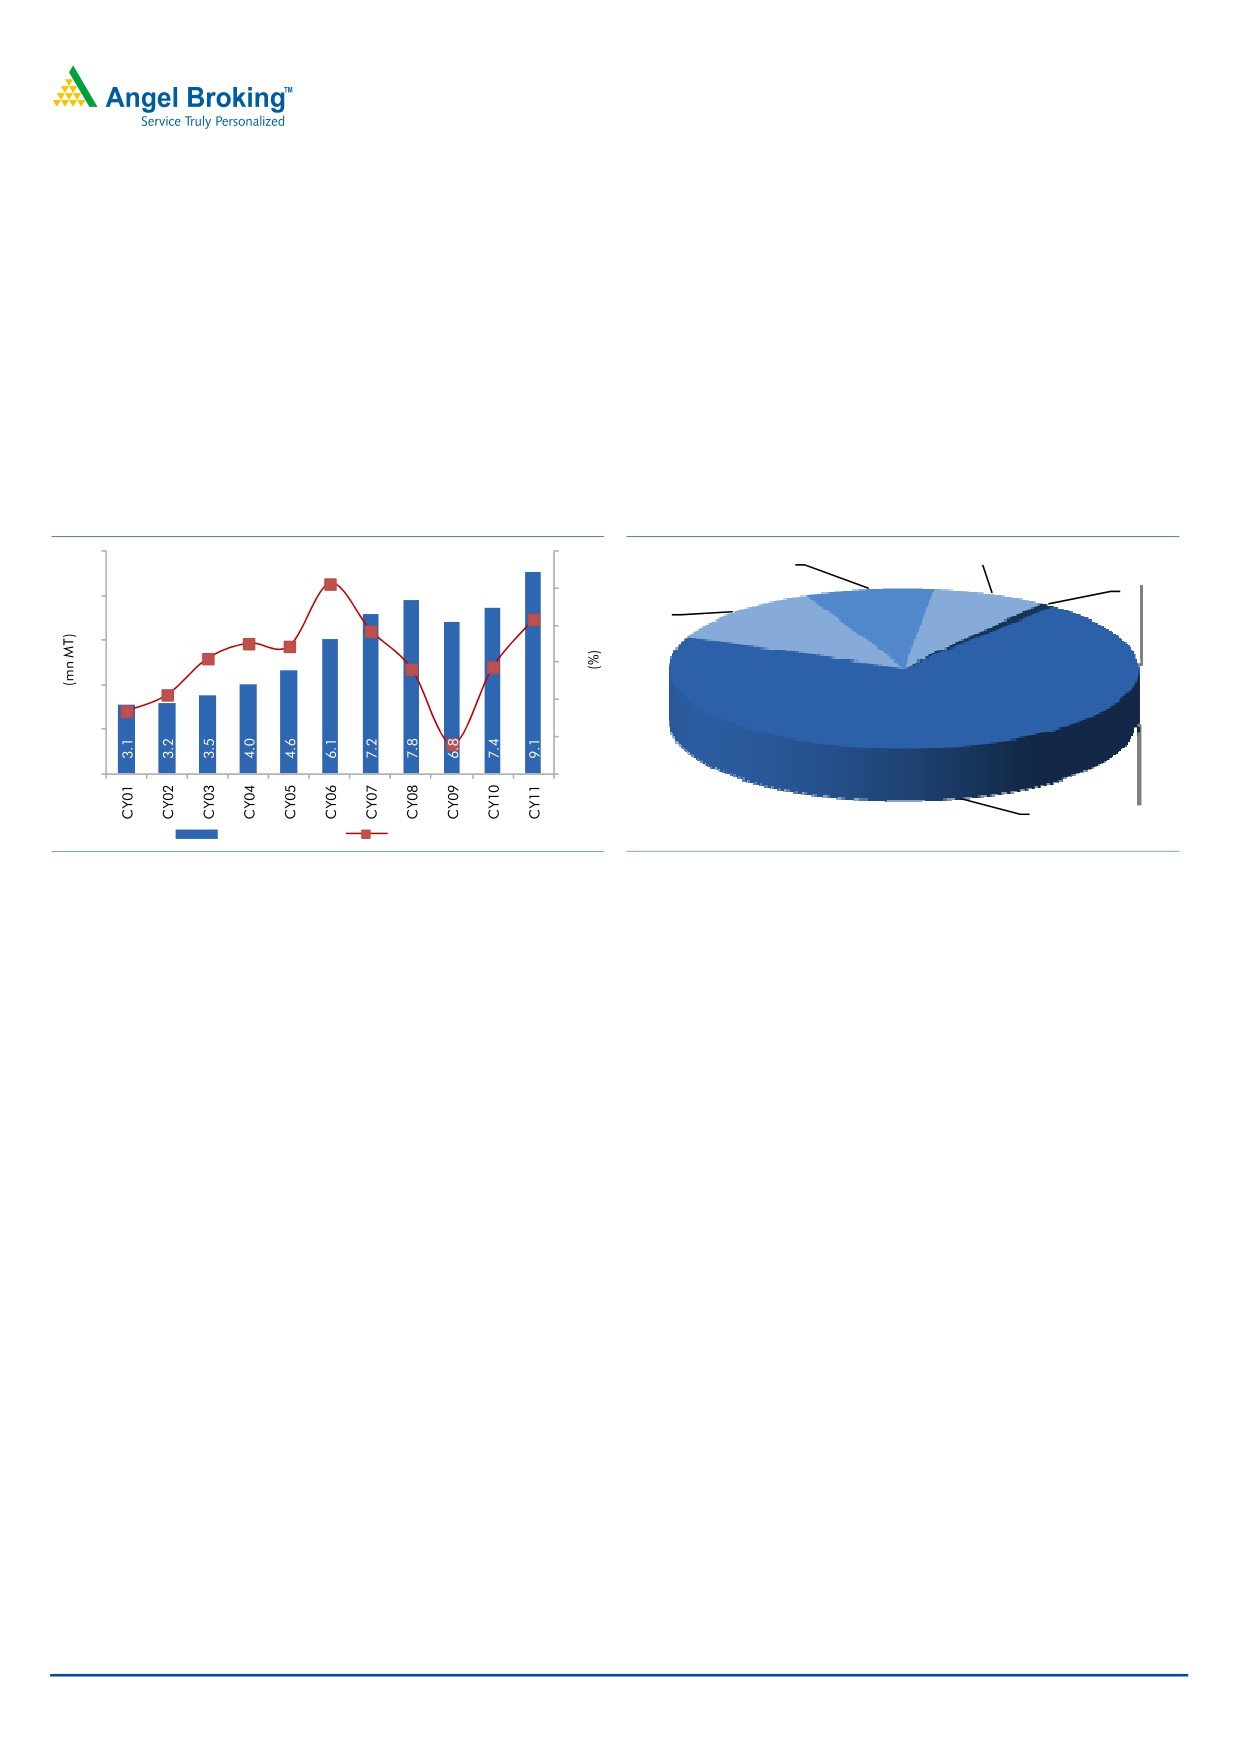
The Indian foundry industry is the second largest producer of casting with a
production of ~9.1mnMT of various grades of castings as per International
standards. The various types of castings which are produced are ferrous, non
ferrous, aluminium alloy, graded cast iron, ductile iron, steel etc for application in
automobiles; railways; pumps compressors and valves; diesel engines;
cement/electrical/textile machinery; aero, sanitary pipes & fittings etc and castings
for special applications. Grey iron castings constitute ~70% of total castings
produced.
Exhibit 8: Production of castings in India
Exhibit 9: Product mix
10
40
Ductile Iron
Non Ferrous
31.2
9%
8%
30
Steel
Others
8
21
.6
18.5
12%
1%
15.1
14.4
20
6
11.1
8.2
8.8
10
1.3
4
(3.1)
0
2
(10)
(12.0)
0
(20)
Grey Iron
Production (LHS)
yoy growth (RHS)
70%
Source: Foundry informatics centre, Angel Research
Source: Foundry informatics centre, Angel Research
There are more than 5,000 foundry units in India. The majority (nearly 80%) of the
foundry units in India fall under the category of small-scale industry. The foundry
industry in India has geographical clustering; the five major clusters are in
Belgaum, Batala/Jalandhar, Coimbatore, Kolhapur and Rajkot.
September 25, 2012
7
Initiating coverage | Disa India
Profit & Loss Statement
Y/E December (` cr)
CY2009
CY2010
CY2011
CY2012E CY2013E
Gross sales
77
117
168
192
221
Less: Excise duty
5
10
14
16
18
Net Sales
71
108
154
176
203
% chg
14.3
30.1
46.0
10.8
14.4
Net Raw Materials
37
59
86
92
106
Power & Fuel costs
0
1
1
1
1
Personnel
10
13
18
22
25
Other expenses
10
14
17
22
25
Total Expenditure
57
87
122
136
157
EBITDA
15
21
32
40
46
% chg
(13.1)
43.2
51.0
25.4
14.5
(% of Net Sales)
20.7
19.6
20.7
22.7
22.6
Depreciation
2
2
2
3
4
EBIT
13
19
30
37
42
% chg
(16.5)
51.5
53.8
23.3
14.9
(% of Net Sales)
17.9
17.9
19.3
20.8
20.7
Interest & other charges
0
0
0
0
0
Other Income
3
4
5
6
7
(% of sales)
4.0
3.9
3.4
3.4
3.4
PBT
15
23
35
42
49
% chg
21.4
21.6
22.6
24.0
24.0
Tax
5
8
12
15
17
(% of PBT)
35.5
35.2
34.7
35.0
35.0
PAT (reported)
10
15
23
28
32
Extraordinary (Exp)/Inc.
0
0
0
0
0
ADJ. PAT
10
15
23
28
32
% chg
(16.9)
53.0
50.4
21.5
14.9
(% of Net Sales)
13.8
14.0
14.7
15.6
15.6
Basic EPS (`)
65.3
100.1
150.1
182.4
209.6
Fully Diluted EPS (`)
65.3
100.1
150.1
182.4
209.6
% chg
(17.6)
53.2
50.0
21.5
14.9
September 25, 2012
8
Initiating coverage | Disa India
Balance Sheet
Y/E December (` cr)
CY2009
CY2010
CY2011 CY2012E CY2013E
SOURCES OF FUNDS
Equity Share Capital
2
2
2
2
2
Reserves& Surplus
39
54
42
52
66
Shareholders Funds
40
56
43
53
67
Total Loans
1
-
-
-
-
Deferred Tax Liability (Net)
0
0
0
0
0
Total Liabilities
41
56
43
53
68
APPLICATION OF FUNDS
Gross Block
34
35
42
50
55
Less: Acc. Depreciation
21
23
25
28
32
Net Block
12
12
17
22
23
Capital Work-in-Progress
-
1
3
2
1
Investments
-
-
-
-
-
Long term Loans & adv
-
-
-
3
3
Current Assets
53
85
109
98
123
Cash
33
47
60
44
61
Loans & Advances
4
7
12
12
14
Inventory
11
18
29
29
32
Debtors
5
13
8
12
14
Other current assets
-
-
-
1
1
Current liabilities
24
42
86
72
82
Net Current Assets
29
43
23
27
40
Mis. Exp. not written off
-
-
-
-
-
Total Assets
41
56
43
53
68
September 25, 2012
9
Initiating coverage | Disa India
Cash Flow Statement
Y/E December (` cr)
CY2009
CY2010
CY2011 CY2012E CY2013E
Profit before tax
15
23
35
42
49
Depreciation
2
2
2
3
4
Change in Working Capital
5
(0)
33
(19)
4
Other income
(3)
(4)
(5)
(6)
(7)
Direct taxes paid
(5)
(8)
(12)
(15)
(17)
Others
(3)
2
(35)
-
-
Cash Flow from Operations
11
14
18
5
32
(Inc.)/Dec. in Fixed Assets
(1)
(2)
(9)
(7)
(4)
(Inc.)/Dec. in Investments
-
-
-
-
-
(Inc.)/Dec. in L.T.Loans & advances
-
-
-
(3)
-
Other income
3
4
5
6
7
Others
(1)
(2)
(0)
-
-
Cash Flow from Investing
1
(1)
(4)
(4)
3
Issue of Equity
-
-
-
-
-
Inc./(Dec.) in loans
(3)
(1)
-
-
-
Dividend Paid (Incl. Tax)
-
-
(35)
(18)
(18)
Others
3
0
35
-
-
Cash Flow from Financing
(0)
(0)
(0)
(18)
(18)
Inc./(Dec.) in Cash
12
14
13
(16)
17
Opening Cash balances
21
33
47
60
44
Closing Cash balances
33
47
60
44
61
September 25, 2012
10
Initiating coverage | Disa India
Key Ratios
Y/E December
CY2009
CY2010
CY2011
CY2012E CY2013E
Valuation Ratio (x)
P/E (on FDEPS)
41.0
26.8
17.8
14.7
12.8
P/CEPS
41.0
26.8
17.8
14.7
12.8
P/BV
10.0
7.3
9.4
7.6
6.0
Dividend yield (%)
-
-
7.5
3.7
3.7
EV/Sales
5.2
3.3
2.2
2.0
1.7
EV/EBITDA
25.2
17.0
10.8
9.0
7.5
EV / Total Assets
9.0
6.4
7.9
6.7
5.1
Per Share Data (`)
EPS (Basic)
65.3
100.1
150.1
182.4
209.6
EPS (fully diluted)
65.3
100.1
150.1
182.4
209.6
Cash EPS
78.5
112.0
164.6
204.7
234.1
DPS
-
-
200.0
100.0
100.0
Book Value
268.1
368.1
285.8
352.1
445.5
Dupont Analysis
EBIT margin
17.9
17.9
19.3
20.8
20.7
Tax retention ratio
0.6
0.6
0.7
0.7
0.7
Asset turnover (x)
1.9
2.2
3.1
3.6
3.4
ROIC (Post-tax)
21.6
25.8
39.1
49.1
45.2
Cost of Debt (Post Tax)
9.5
44.1
-
-
-
Leverage (x)
(0.7)
(0.8)
(1.1)
(1.1)
(0.9)
Operating ROE
49.5
87.7
78.1
98.2
90.4
Returns (%)
ROCE (Pre-tax)
33.5
39.8
59.8
75.6
69.5
Angel ROIC (Pre-tax)
116.3
226.2
-
-
570.0
ROE
24.3
27.1
52.5
51.8
47.0
Turnover ratios (x)
Asset Turnover (Gross Block)
2.1
3.2
4.0
3.8
3.8
Inventory / Sales (days)
83
49
56
60
55
Receivables (days)
22
31
25
25
25
Payables (days)
175
140
191
191
191
WC cycle (ex-cash) (days)
(9)
(13)
(48)
(56)
(34)
Solvency ratios (x)
Net debt to equity
(0.8)
(0.8)
(1.4)
(0.8)
(0.9)
Net debt to EBITDA
(2.2)
(2.2)
(1.9)
(1.1)
(1.3)
Interest Coverage (EBIT / Interest)
38.6
113.6
129.1
138.9
138.8
September 25, 2012
11
Initiating coverage | Disa India
Research Team Tel: 022 - 39357800
DISCLAIMER
This document is solely for the personal information of the recipient, and must not be singularly used as the basis of any investment
decision. Nothing in this document should be construed as investment or financial advice. Each recipient of this document should make
such investigations as they deem necessary to arrive at an independent evaluation of an investment in the securities of the companies
referred to in this document (including the merits and risks involved), and should consult their own advisors to determine the merits and
risks of such an investment.
Angel Broking Limited, its affiliates, directors, its proprietary trading and investment businesses may, from time to time, make
investment decisions that are inconsistent with or contradictory to the recommendations expressed herein. The views contained in this
document are those of the analyst, and the company may or may not subscribe to all the views expressed within.
Reports based on technical and derivative analysis center on studying charts of a stock's price movement, outstanding positions and
trading volume, as opposed to focusing on a company's fundamentals and, as such, may not match with a report on a company's
fundamentals.
The information in this document has been printed on the basis of publicly available information, internal data and other reliable
sources believed to be true, but we do not represent that it is accurate or complete and it should not be relied on as such, as this
document is for general guidance only. Angel Broking Limited or any of its affiliates/ group companies shall not be in any way
responsible for any loss or damage that may arise to any person from any inadvertent error in the information contained in this report.
Angel Broking Limited has not independently verified all the information contained within this document. Accordingly, we cannot testify,
nor make any representation or warranty, express or implied, to the accuracy, contents or data contained within this document. While
Angel Broking Limited endeavours to update on a reasonable basis the information discussed in this material, there may be regulatory,
compliance, or other reasons that prevent us from doing so.
This document is being supplied to you solely for your information, and its contents, information or data may not be reproduced,
redistributed or passed on, directly or indirectly.
Angel Broking Limited and its affiliates may seek to provide or have engaged in providing corporate finance, investment banking or
other advisory services in a merger or specific transaction to the companies referred to in this report, as on the date of this report or in
the past.
Neither Angel Broking Limited, nor its directors, employees or affiliates shall be liable for any loss or damage that may arise from or in
connection with the use of this information.
Note: Please refer to the important `Stock Holding Disclosure' report on the Angel website (Research Section). Also, please refer to the
latest update on respective stocks for the disclosure status in respect of those stocks. Angel Broking Limited and its affiliates may have
investment positions in the stocks recommended in this report.
Disclosure of Interest Statement
Disa India
1. Analyst ownership of the stock
No
2. Angel and its Group companies ownership of the stock
No
3. Angel and its Group companies' Directors ownership of the stock
No
4. Broking relationship with company covered
No
Note: We have not considered any Exposure below ` 1 lakh for Angel, its Group companies and Directors
Ratings (Returns):
Buy (> 15%)
Accumulate (5% to 15%)
Neutral (-5 to 5%)
Reduce (-5% to 15%)
Sell (< -15%)
September 25, 2012
12
Initiating coverage | Disa India
6th Floor, Ackruti Star, Central Road, MIDC, Andheri (E), Mumbai- 400 093. Tel: (022) 39357800
Research Team
Fundamental:
Sarabjit Kour Nangra
VP-Research, Pharmaceutical
Vaibhav Agrawal
VP-Research, Banking
Bhavesh Chauhan
Sr. Analyst (Metals & Mining)
Sharan Lillaney
Analyst (Mid-cap)
V Srinivasan
Analyst (Cement, Power, FMCG)
Yaresh Kothari
Analyst (Automobile)
Nitin Arora
Analyst (Infra)
Ankita Somani
Analyst (IT, Telecom)
Varun Varma
Analyst (Banking)
Saurabh Taparia
Analyst (Banking)
Rahul Kaul
Analyst (Cap Goods, Real Estate)
Bhupali Gursale
Economist
Vinay Rachh
Research Associate
Amit Patil
Research Associate
Shareen Batatawala
Research Associate
Twinkle Gosar
Research Associate
Tejashwini Kumari
Research Associate
Technicals:
Shardul Kulkarni
Sr. Technical Analyst
Sameet Chavan
Technical Analyst
Sacchitanand Uttekar
Technical Analyst
Derivatives:
Siddarth Bhamre
Head - Derivatives
Institutional Sales Team:
Mayuresh Joshi
VP - Institutional Sales
Hiten Sampat
Sr. A.V.P- Institution sales
Meenakshi Chavan
Dealer
Gaurang Tisani
Dealer
Akshay Shah
Sr. Executive
Production Team:
Tejas Vahalia
Research Editor
Dilip Patel
Production
Angel Broking Ltd: BSE Sebi Regn No : INB 010996539 / CDSL Regn No: IN - DP - CDSL - 234 - 2004 / PMS Regn Code: PM/INP000001546 Angel Securities Ltd:BSE: INB010994639/INF010994639 NSE: INB230994635/INF230994635 Membership numbers: BSE 028/NSE:09946
Angel Capital & Debt Market Ltd: INB 231279838 / NSE FNO: INF 231279838 / NSE Member code -12798 Angel Commodities Broking (P) Ltd: MCX Member ID: 12685 / FMC Regn No: MCX / TCM / CORP / 0037 NCDEX : Member ID 00220 / FMC Regn No: NCDEX / TCM / CORP / 0302
September 25, 2012
13